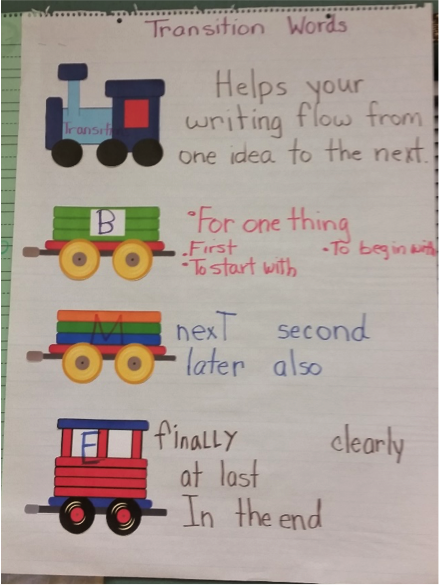
As a continuation of last week’s blog on anchor charts, Lily Newman has posted some ideas to consider when creating anchor charts. Here are her tips on making this strategy most effective.
- Teachers model building anchor charts as they work with students to debrief strategies modeled in a mini-lesson
- Students add ideas to an anchor chart as they apply new learning, discover interesting ideas, or develop useful strategies for problem-solving or skill application
- Teachers and students add to anchor charts as they debrief student work time, recording important facts, useful strategies, steps in a process, or quality criteria
- Students create anchor charts during small group and independent work to share with the rest of the class
Quality Indicators:
- Anchor charts contain only the most relevant or important information so as not to confuse students
- Post only those charts that reflect current learning and avoid distracting clutter—hang charts on clothes lines or set-up in distinct places of the room; rotate charts that are displayed to reflect most useful content
- Charts should be neat and organized, with simple icons and graphics to enhance their usefulness (avoid distracting, irrelevant details and stray marks)
- Organization should support ease of understanding, and be accordingly varied based on purpose
- Charts are best in simple darker earth tones that are easily visible (dark blue, dark green, purple, black and brown—use lighter colors for accents only)
For a wide variety of sample anchor charts, see:
http://www.readinglady.com/mosaic/tools/AnchorChartPhotographsfromKellyandGinger/
By Lisa Rogers
The Education (K-12) Blogs and Special Ed Q & A are written and maintained weekly by Lisa Rogers with Educating Diverse Learners. Lisa received her M.A. in Special Education with an endorsement in the area of individuals with severe disabilities. Mrs. Rogers has also created products that have been used throughout the state of Texas for training purposes. Through the Association for Texas Professional Educators [ATPE], Ms. Rogers has produced an online course that targets the importance of visual strategies for student with autism spectrum disorders and just released her highly anticipated book titled: Visual Supports for Visual Thinkers.


